Market Report: Fishtown, 19125

FISHTOWN Market WatchFISHTOWN continues to be one of the hot Philadelphia Zip Codes. Between the beginning of 2015 and September 1, 2015 there have been 474 recorded sales listed in the Trend MLS. This figure does not include any private sales that were not in the MLS. On average homes spend 57 days on the market with a median DOM of 32 days. The high sale was a property on Shackamaxon Street for $815,000. The low end was a property on North Water Street for a whopping $3,000. The median sale price is $242,000 while the average sale price is a more robust $256,910. The Original List Price (OLP) to Sale Price (SP) ratio was 94.62% during this time period.

The Coyle Group’s team of Philadelphia appraisers are a leading provider of appraisals for Estate/Probate, Divorce, Bankruptcy, Tax Appeal and Pre-Listing. If you need a guest speaker at your next sales meeting, please give us a call. We would welcome to opportunity to speak to your group and field any appraisal related questions you may have. For more information please visit our website at www.TheCoyleGroupLLC.com You can also contact The Coyle Group at 215-836-5500 or appraisals@coyleappraisals.com

Share

Attention Attorneys: That Appraisal May Not Be Valid

If you’re an attorney or legal professional and engage the services of residential real estate appraisers for divorce, estates, bankruptcy or tax appeal, you need to read this.  It could be the simple difference between your case succeeding or failing.

Most attorneys’ primary concern when they order an appraisal is the final value and how it will affect their case. They are usually not too worried with how the report is presented, so long as it is defensible. Many attorneys are used to receiving residential appraisals on the URAR 1004 Form which is the most commonly used Form for residential appraisals.

Why give it a second thought, right?  Wrong.  This could prove to be a huge mistake.

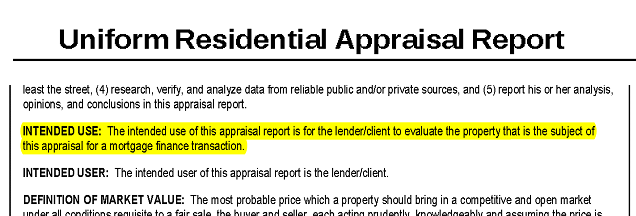
FACT: The common URAR 1004 Form is not intended to be used for valuation matters other than mortgage finance. (It even says so right in the report.)

The Coyle Group - URAR Blurb


Yet, all too often, this is the “go to” Form for appraisers who may not be experienced performing appraisal for legal purposes. Their mistake could cost you your case.

Imagine being in court for a hearing and presenting your appraisal prepared on the URAR 1004. While the court may not know the nuances of the Intended Use of a URAR 1004, a savvy opposing counsel, township solicitor or expert appraisal witness could very easily point this out. Technically, the report is invalid as a result of the Form’s Intended Use being violated by the appraiser. The court could deem the report inadmissible and jeopardize your client’s case.

There is a simple solution. There are a number of general purpose appraisal forms available to residential real estate appraisers that are also in compliance with USPAP*. They are typically called GPAR Forms (General Purpose Appraisal Report) and they address most residential usages (single family, multi-family and condo.)  The Appraisal Institute has even developed its own USPAP compliant GP Forms as have most appraisal software providers.

The Coyle Group - GPAR

So, next time when ordering an appraisal; be sure to specifically ask your appraiser which Form they intend use. If they say the URAR 1004, you need to insist that they use a GPAR Form or you run the risk of presenting an invalid appraisal.

Hopefully, you found this informative and helpful. If we can ever be of assistance with your appraisal needs for estates, divorce, bankruptcy and tax appeal; or if you have any appraisal related questions, please do not hesitate to contact us at 215.836.5500 or appraisals@coyleappraisals.com .

* USPAP: Uniform Standards of Professional Appraisal Practice

Share

The Coyle Group – YouTube

The Coyle Group Real Estate Appraisal Video

Please watch our new video that outlines many of the services that the real estate appraisers at The Coyle Group provide to attorneys, accountants and private individuals across Philadelphia, Montgomery County, Bucks County, Delaware County & Chester County.

Share

Mount Airy Trends

Being located in Erdenheim, just outside the city limits, we are frequently asked to appraise properties in northwestern Philadelphia, especially Chestnut Hill, Mount Airy, Roxborough and Manayunk. 

The other day we received our first question for the Ask PAB! section of the site.  It was submitted by a local agent who works primarily in the northwest section of Philly.  She typically deals with entry level and first time buyers.  For that segment of the market, Mount Airy offers a great selection of housing options for her clientele, in a wide range of price points and design styles.   It has very appealing housing stock, access to transportation, shopping, proximity to Center City and the suburbs and very unique community atmosphere.  Her question was simply:

 “How have Mt. Airy twins and rows been performing over the past couple of years?”

Below is a chart of the sales of 3-4 bedroom twins and rowhomes in Mt. Airy from January 2008 through December 2010.  Click on the chart to enlarge.

The blue dots indicate the sales of 3 bedroom homes; the red dots represent the 4 bedroom sales.  Our sample produced 341 sales of 3 bedrooms and 105 sales of 4 Bedroom homes, in Mt. Airy, during that time period.  The green and yellow lines depict the linear sale price trends for 3 and 4 bedroom houses, respectively.

The trend lines indicate that both 3 and 4 bedroom homes are moving downward.  However, it appears as though the 4 bedroom properties are experiencing a deeper shift that the 3 bedrooms, which are riding a flatter trend.  This is likely due to the fact that there are fewer 4 bedrooms homes and, as a result, fewer 4 bedroom sales.  With a smaller sample, it is easier for a few sales to influence the trend.  Conversely, with a greater number of samples it is less likely that a handful of sales to move the trend so dramatically.

If you have a question about real estate markets and trends in the Philadelphia region, please visit our Ask PAB! page to submit your inquiry.

Share

Camden’s Woes

Walt Whitman once called Camden, “A City Invincible”.  Undeniably, Camden is far from invincible at this point; perhaps, “unprotectable” would be more appropriate. 

Despite last minute efforts, ongoing negotiations and political wrangling, the fact remains that, Camden, New Jersey, laid off 168 police officers and more than 60 firefighters.  That’s more than 45% of the entire Camden Police Force.  Unbelievable!

Just to refresh your memory, this is the same Camden that was named the nation’s second most dangerous city in the United States in 2010…having lost it’s spot as the most dangerous city in the U.S. in 2009.

This situation is the result of a $26.5 million dollar deficit, declining State aid, dwindling tax revenue and inflexible unions.  Camden is one of the nation’s most impoverished, corrupt and violent cities.  The median household income is less than $27,000 per year.  Once an industrial hub along the Delaware, the city has been eroding and with no reason to stay, businesses and industry have been fleeing Camden for decades.  The most recent evacuee was Campbell’s Soup, leaving hundreds unemployed and a huge hole in the tax base.   

From a real estate value perspective, this could be the kiss of death for Camden.  Who wants to live or work in a community where you do not feel safe?  Granted, the feeling of safety is relative but, now with almost half of the “good guys” gone, the vulnerability felt by the average Camden resident and business is only going to be amplified. 

Many of the fundamental principles that drive real estate values are tied directly to human needs.  One basic human need is for a person to feel safe in their own home.  Another human instinct is flight from danger.  Inevitably, those residents who can afford to will leave Camden for safer havens.  Those remaining will be those who can’t afford to leave, the poor, and those who don’t want to leave, the criminals, the dealers and the addicts. 

When residents begin leaving, the ripple effects will be felt throughout the Camden real estate market.  Rental vacancies will increase resulting in decreasing rental incomes.  Listing inventories will swell and prices will begin to drop as more and more sellers try to attract fewer and fewer buyers.  Vacant and abandoned homes will also add to the problem as property owners decide to cut their losses and walk away.

The simple economic principle of supply and demand would point toward continued declining property values in Camden, in the near and foreseeable future, regardless of whether or not an agreement can be reached between the City and Police Union.

Despite all Camden’s social, governmental and economic woes, there is room for hope.  From a real estate viewpoint Camden does have some good things going for it.  It has the waterfront, bridge access to Philadelphia, rail access to New York, Cooper Hospital, Rutgers University, The Comcast Center, the Camden Adventure Aquarium and the Rivershark’s Stadium.

With luck, entrepreneurial spirits will step forward, and private investors and developers will decide to take a risk.  It may not happen in the next few years.  It may not happen in our lifetime.  However, I believe that the private sector will step in as some point and initiate a profitable effort to reinvent the decaying city, making it once again worthy of Whitman’s words.

In the meantime, we can only hope and pray for the safety and well-being of our neighbors (and remaining Police and firefighters), in Camden.

Share

TReND Distressed Sales Report

TReND, the Multiple Listing Service that serves the Greater Philadelphia Markets, does a great job of publishing timely and relevant reports about real estate trends in the Philadelphia area.   Below is the report that they released this week showing the affect of Distressed Sales on the local markets.  TReND is always trying to improve their service and this is just another example of the new and innovative products that they offer.

Frankly, after reviewing the report, I was surprized to see that Philadelphia was lower in terms of distressed sales than some counties in New Jersey and Delaware.    But, it’s all relative to the total number of sales and, Philly, by far has the greatest volume of sales.

ThanksTReND!

Below is a link to the full report.  If, for some reason you can’t get to the report, let me know.

Distressed Sales: TREND Percentages Lower Than National Average. 

Share

The Roxborough Row


Philadelphia is known as a city of neighborhoods. When Philadelphians meet one another for the first time it’s not long before someone asks “what neighborhood are you from?”

Neighborhoods can be as small as a few square blocks or cover large sections of the city. One such neighborhood is the Roxborough section of Philadelphia. It occupies much of the northwestern portion of the City abutting Montgomery County, along with Manayunk and Chestnut Hill. It has always been a solid, working class area with strong family values and sensibilities.

The staple of the Roxborough housing stock is the three bedroom, single family attached rowhome or townhouse. Many were built to satisfy the housing needs of the local factory workers and to keep up with urban sprawl. Depending on which part of the Boro you are talking about the homes were generally built between 1865 and 1970. These are still very popular housing choices for first time homeowners and investors.

Below is a chart of the sales activity of the typical 3 bedroom Roxborough Row over the the past four quarters (2009 Q4 – 2010 Q3). As you can see, the number of sales spiked to 36 in 2010 Q2. This is a direct result of the tax credit that was being offered to first time homebuyers. The three bedroom Roxborough Row was essentially made for this program due to its attractiveness to first time buyers and those targeted buy the tax credit program. You will notice that in 2010 Q3, after the sunset of the credit, sales of the Rows dropped off by more than 60%, which was just where sales were prior to the credit program.

The next chart compares the Average and Median Sale Price for three bedroom Roxborough Rows over the same time period. In 2010 Q1, the Average Price spikes up to $271,042 despite only 12 sales during that quarter. The reason for the skewed average is two or three higher sales of newer townhouses that pulled the average up. Note that the Median Sale price tracks right along with the other quarters. The Median Sale Price for Roxborough Row has hovered between $204,900 in 2009 Q4 to a high of $214,500 in 2010 Q1. In 2010 Q2, the median began to settle into a more traditional trend eventually getting back down to $205,250 in 2010Q3…almost even with where it was in 2009Q4, prior to the tax credit.

It goes to show, that despite government interference with credits and incentives, the markets will correct themselves. It also goes to show that the Roxborough Row is the backbone of this market and can withstand outside market influences. Perhaps that’s why it’s been around for so long and continues to show consistent and measurable value.

Share

Chestnut Hill Luxury Market

Recently, The Coyle Group, LLC Real Estate Appraisers & Consultants completed an analysis of the Chestnut Hill Luxury Home Market from January 2000 to the present.

In our analysis, the Luxury Market was defined as the top 20% of single family homes sold in Chestnut Hill. Only sales listed in the MLS were part of the analysis. Private sales and sales occurring outside of the MLS listings were not included.

There were a total of 1,186 single family homes sold in Chestnut Hill since January 2000. This figure takes into account all price points. The top 20% (totaling 237 sales) were included in this analysis as the Luxury Market. Below is a graph of the sales activity that was tracked along with a trend line that illustrates the overall trend for the Chestnut Hill Luxury Market over the span of more than 9 years.

The bottom of this segment began at $675,000 and topped out at $3,300,000. The average sale price over the entire time period was $1,060,840, with a median sale price of $912,000.

One of the metrics that were tracked was the List Price to Sale Price Ratio. The cumulative average LP/SP ratio was 96.14%. This means that, on average, since January 2000, homes in the Chestnut Hill Luxury Market have been discounted approximately 4% from their most current asking price. The time period with the most full or over full price sales was between 2004 and 2007, totaling 53. The time period with the fewest full price sales was from January 2008 to the present. In that period, there were only 9 sales that went for full price.

Observing the trend line, the Chestnut Hill Luxury Market appears to be leveling out from the highs of 2006-2008 and more recent declines through the end of 2008 thru 2010. The trend even shows signs of incremental upward movement. This is positive news for this market. However, looking at the historical data the current market is roughly in line with the market from Spring 2005.

The Coyle Group, LLC is a group of professional Real Estate Appraisers and Consultants serving the Greater Philadelphia markets, including Chestnut Hill. For more information on our services such as Pre-Listing Appraisals, please contact our office at 215-836-5500 or visit our website www.thecoylegroupllc.com .

Share

South Philly Door

Part of our coverage area is the City of Philadelphia.  Obviously, being located just outside the city limits of the 5th largest metropolitan market in the county, it would be a pretty poor business decision not to appraise properties in Philadelphia.

The other day I was in South Philly…one of my favorite parts of the City.  South Philly is a patchwork of small neighborhoods, each with their own character and flavor.  This stems from the immigrant population that used to live in these tight knit communities when they were built to house factory workers in the late 1800’s thru 1940’s.  Each group (Italians, Irish, Germans, Jewish, etc.) imprinted their own ethnicity and personality on the neighborhoods. 

Frankly, it’s what makes South Philly great!

The most common housing type in South Philly is the 2-story, flat front row house.  They are anywhere between 11′ to 16′ (the masons weren’t too exacting) wide and typically have 2 to 4 bedrooms.  It was easy to build them quickly and at a high density.  It’s not uncommon to have 60 homes or more in one city block.

Being that the houses were so bland and homogeneous, there wasn’t much a builder could do to make his product different from the next builder’s.  Some used shutters and ornate cornices, but others used the front door to make their statement.

This South Philly red door is a prime example of how Philadelphia builders at the turn of the last century added a little curb appeal to their homes.  This door is original with it’s “keyhole” shaped leaded glass window, brass mail slot and old “crank” style doorbell.  It really sets this house apart from the others on the block.

Funny how curb appeal is still so important when it comes to real estate.  

Share

Price vs Value

I was invited to speak at the monthly meeting of local Caldwell Banker Agents and Brokers. I was there to discuss the appraisal process, recent market trends and how the HVCC is affecting agents and their clients.

After speaking, I opened up the floor to questions. One of the first questions was a great one. The agent asked me to explain the difference between Price and Value. I’ve been thinking about it and have come up with the following explanation.

When viewed against the backdrop of recent marketplaces shifts both locally and nationally over the past few years, the difference between Price and Value has become more and more important to understand. In fact, I feel that most Agents and their clients are using the terms incorrectly.

When discussing a property most Agents and their clients are thinking in terms of price. “What is the price of the house”, “will they come down in price”, “that price is high/low” and my favorite “did the appraisal come in at the selling price?” The fundamental problem in these scenarios is that it is not about price, it’s about value. The focus should be on what the value of the home is, not the price. Value takes into consideration today’s market and underlying market conditions. Price often does not.

Price is a marketing tool. By setting a price, the Seller is actually choosing a segment buyers who will hopefully see the price as being the value of the property. The closer the Seller positions the price to the true value of the property, the larger the pool of potential Buyers the house will appeal to. Just the opposite is true, as well. The further the price is placed from the actual value of a property, the smaller the pool of buyers who will see that value.

An example of this was this property in Gladwyne. This property was listed in 2009 for $19,500,000. It was eventually withdrawn from the market. In 2010, it was re-listed for $17,900,000. All totaled, the house sat on the market for more that 660 days.

This is a situation where the Seller priced the house so far above the perceived value placed on it by the market, that they effectively diminished the pool of potential buyers to zero. This market did not support the price that was being asked

Remember value is guided by the market. Price is guided by the individual Selling the property. If the price is not supported by the market, no sale will occur.

Common perception is that price and value are interchangable. They are not. Value relates to what something is really worth.  That is, what could one expect to receive in terms of money in the free market?  It doesn’t matter what the value was last year, last month, or even last week. Value is determined by the conditions and influences of the current marketplace. Too often, sellers get hung up on that fact when the marketplace moves in the other direction. They don’t want to acknowledge the fact that their home was worth $800,000 a year ago and, based on supply and demand, is only worth $700,000 in today’s market. Value is determined by the scarcity of something and the ease of replacement with similar, equal, or better products or service (i.e. The Principle of Substitution).  In its most basic form, this is a simple function of supply and demand.

Share